Debugging in the Mini Debugger
The mini debugger is a floating window that provides debugging controls similar to those of the text editor (see “Debugging in the Text Editor”) and the debugger (see “Debugging in the Debugger”), but that don’t require your switching back and forth between your application and Xcode.
The mini debugger has two modes, depending on whether the debugged process is running or stopped. When the process is running, the mini debugger provides controls to pause and stop the process, display the program’s Xcode project, and activate or deactivate breakpoints. When the program is stopped (after reaching a breakpoint, for example), the mini debugger provides a debugging experience similar to the one provided by the text editor. In fact, when the your program is stopped, the mini debugger’s entire content is made up of a text editor, although you cannot edit the source files it displays.
Opening the Mini Debugger
To show the mini debugger while running your application, choose Run > Mini Debugger.
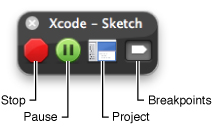
Figure 4-1 shows the mini debugger with a running program.
You can tell Xcode to always open the mini debugger when you debug a product using the On Start menu in Xcode Preferences > Debugging. See “Debugging Preferences” in Xcode Workspace Guide for more information.
Using the Mini Debugger
These are the icons the mini debugger shows when the program is running:
Stop: Terminates the program.
Pause: Pauses the program.
Project: Opens the program’s Xcode project.
Breakpoints: Activates/deactivates breakpoints.
Figure 4-2 shows the mini debugger after the program stops.
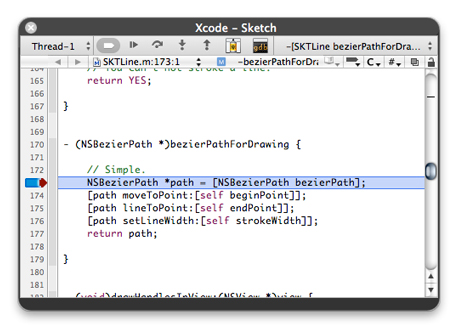
For more information about debugging in the mini debugger, see “Debugging in the Text Editor.” Keep in mind that the text editor in the mini debugger doesn’t allow you to edit source files.
© 2009 Apple Inc. All Rights Reserved. (Last updated: 2009-10-19)

